A recent study by Unbounce shows the important role of website performance in driving online sales. Nearly 70% of consumers say page speed influences their likelihood to buy. Similarly, research by Aberdeen Group found that a 1-second delay in page load time leads to a 7% drop in conversions.
In other words, websites that fully load quickly can enhance user satisfaction, contribute to higher engagement, and help increase conversion rates. Fast websites that keep visitors engaged will reduce bounce rates and, ultimately, boost business outcomes.
GTmetrix is a tool that assesses and improves website speed. It provides insights into page structure, assesses load time, and offers distinct tips for performance improvement. With tools like Google Page Speed Optimizer, you can even incorporate GTmetrix analytics into your existing optimization strategy. In the guide below, we'll break down this topic, exploring what GTmetrix is and how to interpret its results.
What is GTmetrix?
GTmetrix is a powerful website performance analysis tool that evaluates speed and optimization issues. It uses data from PageSpeed Insights and YSlow to generate Performance and Structure scores, offering a clear grading system. These scores help developers quickly identify key areas for improvement, such as load times, page structure, and optimization opportunities.
A key feature of GTmetrix is its ability to simulate different devices, browsers, locations, and internet speeds, including mobile options. This helps users see how their websites perform in various real-world conditions and even parts of the globe.
Read More: Best Practices for Improving Website Speed
How to Use GTmetrix for Performance Testing
To gain the most from GTmetrix, it's important to understand its functionalities and the steps involved in conducting a thorough website speed test. Let’s take a look at how to run a website speed test in GTmetrix.
1. Set Up an Account
Your first step is signing in. GTmetrix offers both free and Pro accounts. While the free version provides ample features for basic analysis, upgrading to GTmetrix Pro unlocks advanced capabilities such as:
- GTmetrix mobile device testing
- Hourly monitoring
- Video playback to analyze loading sequences
- In-depth performance reports with historical data
2. Configure Locations and Conditions
Before running a test, choose a test location that best represents your audience. Mind that this option is only available for logged-in users, otherwise, the default location is set to Vancouver, Canada. If your business has a global reach, this feature ensures your website is optimized for various geographic regions.
You can also adjust test conditions such as browser type (Chrome or Firefox), device (desktop or mobile devices), and connection speed (broadband, 3G, or 4G) to simulate various real-world user experiences.
3. Run a GTmetrix Speed Test
To start, enter your website URL in the GTmetrix test bar and select "Analyze." The tool will then generate a comprehensive report that includes Performance scores, key metrics, and recommended optimizations.
GTmetrix Result Tabs: Summary, Performance, and Structure
GTmetrix provides three key tabs in its performance report: Summary, Performance, and Structure, each offering unique insights to help optimize your website’s speed and efficiency. Let’s review the contents of each tab.
Summary Tab
The Summary tab gives a high-level overview of your website's performance, combining insights from the Performance and Structure tabs. It includes:
- GTmetrix Grade – An overall score based on performance and structure. We’ll talk about interpreting them below.
- Web Vitals Assessment – A quick snapshot of whether your site passes Core Web Vitals.
- Page Details – Metrics such as page load time, total page size, and the number of requests made by the page.
The Summary tab is useful for getting a quick understanding of your website's health and identifying areas that need immediate attention.
Performance Tab
The Performance tab actually presents your site’s front-end performance audit, analyzing the Critical Rendering Path.
The Critical Rendering Path (CRP) is a core concept in front-end performance architecture that describes the sequence of steps a browser takes to convert HTML, CSS, and JavaScript into pixels on the screen. In other words, it’s the path your code travels before a user actually sees anything.
The Performance tab evaluates your website’s front-end speed using real-world user experience metrics. It focuses on Google's Core Web Vitals, which include loading time analysis, interactivity, and visual stability. Key metrics include:
- Largest Contentful Paint (LCP) – Measures the amount of time taken to render the largest visible content element (for instance, an image or a text block).
- Total Blocking Time (TBT) – Assesses interactivity delays caused by heavy JavaScript execution.
- Cumulative Layout Shift (CLS) – Evaluates unexpected visual shifts that impact user experience.
Overall, this tab provides a score derived from Lighthouse and offers suggestions to enhance overall page speed and responsiveness.
Structure Tab
Finally, the Structure tab analyzes your website's code and architecture, focusing on technical optimizations based on Lighthouse recommendations. It provides insights into:
- Opportunities for improvement, such as reducing unused CSS/JavaScript, optimizing images, and improving caching strategies.
- Breakdown of issues categorized by priority, allowing developers to address critical factors affecting speed.
- Recommendations with actionable insights, helping you fix structural inefficiencies and improve website loading behavior.
GTmetrix also features the Waterfall Chart tab – a testing tool for visualizing the loading sequence of various page elements, including images, scripts, and third-party resources. This detailed breakdown helps identify performance bottlenecks, such as slow-loading files, large assets, or excessive HTTP requests.
Read More: How to Achieve a 100 Score on Google PageSpeed Insights?


GTmetrix Grade System Explained
To effectively conduct website speed optimization tests, you should understand the GTmetrix grading system. The tool uses its own GTmetrix Grade system (A to F) to summarize overall performance while also incorporating other scoring factors derived from Google's Lighthouse and Web Vitals metrics.
Here’s how to interpret each GTmetrix score:
- A (90-100) – Excellent performance. Your website is optimized well, with fast load times and minimal performance issues.
- B (80-89) – Good performance. Your site is performing well but may benefit from some minor optimizations to improve speed and efficiency.
- C (70-79) – Average performance. Your website has noticeable delays and optimization opportunities to improve load time and user experience.
- D (60-69) – Below average. Significant performance issues are affecting your site’s loading speed, and optimizations should be prioritized.
- F (below 60) – Poor performance. Your site has major issues that need urgent attention to improve loading speed and overall user experience.
So, what is a good GTmetrix score? A decently competitive GTmetrix grade falls in the 80-100 range. However, a top score may not ensure a superior user experience if certain user segments experience loading issues.
Optimization Tips Using GTmetrix Recommendations
If you're looking to increase page speed with GTmetrix, the tool provides detailed reports and recommendations to pinpoint areas for improvement. In a way, it serves as a guide for actionable optimization. Here are some practical steps to improve site performance based on GTmetrix recommendations:
Image Compression: Large images can significantly slow down web loading times. Using tools to compress images without sacrificing quality can boost speed. Choose lighter image formats like WebP.
Minifying JavaScript/CSS: Reducing the size of these files can minimize load times and enhance performance.
Utilizing CDNs and Caching: Content Delivery Networks (CDNs) distribute content across various global servers, decreasing load times for users worldwide due to faster server response times. Similarly, browser caching can reduce repeat visit load times. For Magento 2 stores, advanced solutions like a Full Page Cache Warmer proactively prepare the cache to ensure the fastest possible load for both new and returning visitors.
Eliminate Render-Blocking Resources: JavaScript and CSS files that load before visible page content can delay rendering. Deferring or asynchronously loading non-critical scripts ensures that above-the-fold content appears quickly, improving perceived speed and Core Web Vitals.
Optimize Third-Party Scripts: External scripts can slow down performance. Auditing, deferring, limiting, or lazy loading third-party resources prevents them from blocking rendering and reduces their impact on loading time.
Mobile Page Speed Improvements: Mobile users often experience slower connections and more constrained resources, making mobile optimization essential. Responsive image sizes, lighter CSS and preloading critical resources are must-haves for mobile-first indexing, as they create a smoother user experience on smartphones and tablets.
After you implement optimizations, don’t forget to perform iterative tests with GTmetrix to ensure continuous improvements. Regular testing allows you to gauge the effectiveness of your changes and respond to any new performance issues that might arise based on your specific platform.
Read More: How to Speed Up Your Magento 2 Store
Free vs Pro GTmetrix Features
GTmetrix Free offers basic performance reports, PageSpeed and YSlow scores, limited test locations, waterfall charts, and standard recommendations. GTmetrix Pro unlocks more advanced capabilities, including video playback, more global test regions, mobile device testing, longer data retention, priority queuing, and advanced monitoring. Pro plans are ideal for agencies, performance-focused stores, or sites needing continuous tracking and in-depth diagnostics.
Advanced Features of GTmetrix Pro
As we’ve mentioned earlier, GTmetrix Pro offers advanced features that enhance analysis and provide deeper insights into web performance. Here’s exactly what makes the Pro option more advanced:
Video Playback
This feature provides a visual representation of the page-loading process, that displays the sequence and timing of each element as it loads. It shows exactly where delays occur, which helps to identify specific elements that slow down the page.
Advanced Filtering Options
These options give you the ability to sort through data and concentrate on particular performance metrics that matter most to your site. With the ability to customize your analysis, you can zero in on specific issues, such as slow-loading elements or excessive HTTP requests, ensuring a more targeted and effective optimization process.
Custom Reports
This feature allows you to create tailored reports that highlight specific performance metrics and key areas of interest. Custom reports facilitate better tracking of performance over time and provide detailed insights that are crucial for decision-making and strategy adjustments.
Alternatives to GTmetrix
WebPageTest
WebPageTest offers highly detailed performance diagnostics, including filmstrips, network waterfalls, and real-browser testing from multiple global locations. GTmetrix is easier to use and provides clear grades and actionable recommendations, making it more beginner-friendly. When comparing WebPageTest vs GTmetrix, GTmetrix focuses on speed scores and optimization tips, and WebPageTest gives deeper technical insights for developers who need granular performance data.
Google PageSpeed Score
Google PageSpeed Insights measures how well your website aligns with Core Web Vitals and modern performance standards. It provides separate mobile and desktop scores along with suggestions to improve loading speed, interactivity, and visual stability. Unlike GTmetrix, which simulates loading conditions, PageSpeed Insights uses real-user data (CrUX) when available, offering a view of real-world performance. Core Web Vitals can be tracked via Google Search Console.
Comparison of GTmetrix with Other Speed Testing Tools
GTmetrix isn’t the only performance testing tool available on the market. Here’s an overview of key features offered by GTmetrix, Google PageSpeed Insights, and WebPageTest:
Feature | GTmetrix | Google PageSpeed Insights | WebPageTest |
|---|---|---|---|
Website Performance Analysis | ✅ | ✅ | ✅ |
Page Load Time | ✅ | ✅ | ✅ |
Performance Score | ✅ | ✅ | ✅ |
Testing Locations | ✅ | ❌ | ✅ |
Browser Support | ✅ | ✅ | ✅ |
Device Simulation | ✅ | ✅ | ✅ |
Historical Data Tracking | ✅ | ❌ | ✅ (with account) |
Waterfall Charts | ✅ | ❌ | ✅ |
Video Capture | ✅ | ❌ | ✅ |
Free Tier Available | ✅ | ✅ | ✅ |
Mobile Network Throttling | ✅ | ❌ | ✅ |
Advanced Scripting | ❌ (limited) | ❌ | ✅ |
Business benefit of using GTmetrix
Conversion Rate Optimization
GTmetrix helps identify performance bottlenecks that slow down your website. By improving page speed, businesses create a smoother user experience that encourages visitors to complete purchases, sign up, or engage – directly boosting conversion rates.
Reduce Bounce Rate with Faster Load Times
Slow websites cause users to abandon pages within seconds. GTmetrix highlights issues such as large images, slow scripts, and render-blocking resources, enabling you to fix them and deliver faster load times. A faster site improves user experience (UX) and customer experience (CX), keeping visitors engaged longer and significantly reducing bounce rates.
Increased Organic Search Traffic
Google uses page speed and Core Web Vitals as ranking factors. By following GTmetrix recommendations, websites can improve performance scores, enhance mobile usability, and meet Google’s speed criteria, resulting in better search visibility and higher organic traffic.
E-commerce Speed Optimization
In online stores, every second of delay affects product views, cart additions, and checkout completions. GTmetrix provides actionable insights into how quickly product pages, category listings, and checkout flows load, helping merchants eliminate delays and optimize the entire shopping experience. A fast storefront can be combined with optimized checkout tools to handle complex pricing scenarios smoothly and maximize order value.
Speed Optimization for User Retention
Fast, responsive websites encourage repeat visits. GTmetrix’s ongoing monitoring and performance alerts help businesses maintain optimal load times, ensuring users consistently get a smooth and reliable experience—key to long-term retention and brand loyalty.
Better Sales and ROI
Performance improvements directly impact revenue. Faster sites convert more efficiently, reduce operational friction, and improve customer satisfaction. By using GTmetrix to continuously optimize speed, companies see measurable improvements in sales and overall return on investment.
Real Success Stories with GTmetrix
GTmetrix has helped many businesses significantly enhance their website performance. Here are some illustrative examples:
RankPay
RankPay, a search engine optimization company, utilized GTmetrix to analyze and improve their website's performance. By identifying and addressing performance issues, they reduced their site load times from approximately 5 seconds to 1.8 seconds. This improvement resulted in:
- A 20% reduction in bounce rate.
- A 3.5-second reduction in homepage load time.
- An estimated 10% increase in overall organic presence.
This real-world GTmetrix case study demonstrated that enhancements contributed to a noticeably faster site experience for both new and returning users.
Yael Consulting
Yael Consulting, an online advertising agency, used GTmetrix to boost their website's performance, significantly impacting their Google Ads conversion rates. By leveraging GTmetrix and its Waterfall chart, they identified a key performance issue – long API requests to third-party services. Their improvements resulted in:
- An increase in Google Ads conversion rates from 1.20% to 2.61% through faster page load times.
- A reduction in the website’s LCP from 2.3 seconds to 1.5 seconds and total blocking time – from 1.7s to 0.6s.
These performance enhancements not only improved their site speed but also led to a significant boost in sales. After resolving the third-party issue and optimizing LCP and TBT, the client experienced such high demand that their top products sold out.
Amasty
Amasty used GTmetrix to assess the performance of a customer’s Magento-powered home décor store after migrating it to a Hyvä theme. By leveraging GTmetrix and its performance analysis tools, our team identified key issues such as excessive JavaScript execution and inefficient CSS delivery. The performance optimization resulted in:
- A reduction in the website’s Largest Contentful Paint (LCP) to just 0.8 seconds.
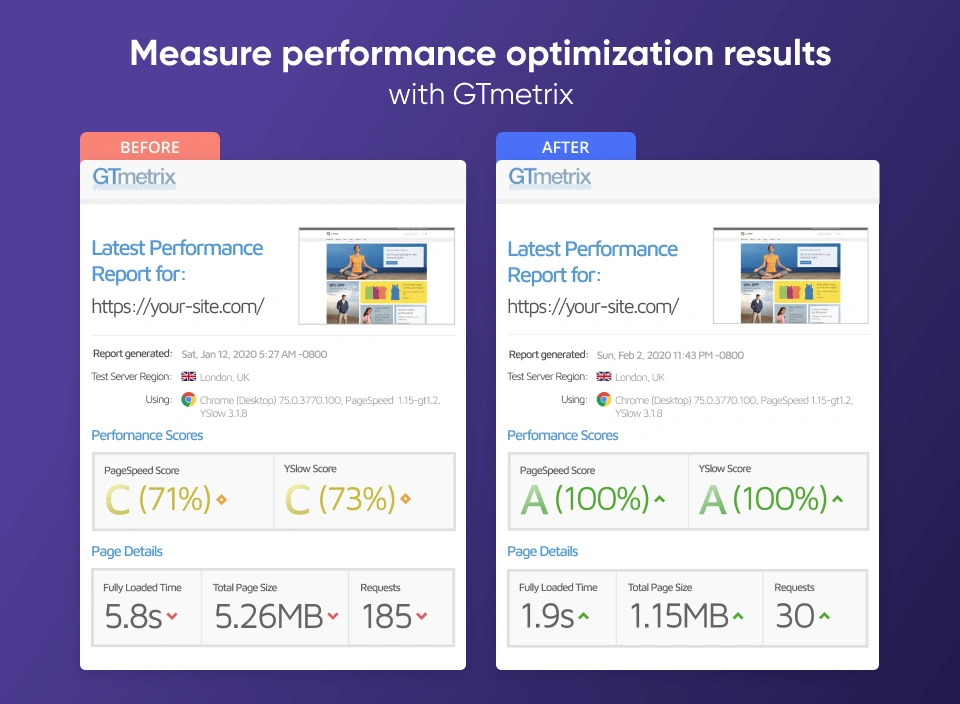
- An increase in the GTmetrix PageSpeed score from 65% to 98%.
These enhancements not only improved site speed but also enhanced the user experience and boosted conversions on the client's side. Read the full story here.
Boost Your Website Speed with GTmetrix
We hope this overview has shown you how essential GTmetrix is for website optimization. It’s an excellent tool for pinpointing performance issues and boosting your speed. Real-world case studies we’ve shared also demonstrate that high speed equals better conversion rates.
Try out GTmetrix to test your site performance and follow the tips for improvements. And in case you need expert assistance with e-commerce store speed, don’t hesitate to turn to Amasty. We offer a Magento performance audit for free and provide dedicated Shopify speed optimization services.